-

As expected, Siltronic AG’s business performance in Q2 2024 was again characterized by weak demand in the wafer market, which resulted from continued increased inventories in the chip industry. Due to the lower wafer area sold, half-year sales of EUR 694.8 million were significantly lower than in the same period of the previous year (H1 2023: EUR 808.2 million). However, at EUR 351.3 million, sales in Q2 2024 slightly exceeded the previous quarter (Q1 2024: EUR 343.5 million) by 2.3 percent.
“Q2 was in line with expectations. On a positive note, the end markets, partially driven by Artificial Intelligence, will grow this year. However, this is not yet reflected in our order situation due to still elevated inventory levels. We are pleased that we were able to slightly increase our sales in Q2 compared to the previous quarter and continued to achieve a solid EBITDA margin of 25.8 percent,” comments Dr. Michael Heckmeier, CEO of Siltronic, on the development.
Business development in H1 2024 influenced by weak demand, sales prices almost stable
In Q2 2024, Siltronic generated sales of EUR 351.3 million, up 2.3 percent on the previous quarter (Q1 2024: EUR 343.5 million) due to the increase in wafer area sold. Sales prices were almost unchanged quarter-on-quarter. Sales of EUR 694.8 million were generated in H1 2024 (H1 2023: EUR 808.2 million). The decline is primarily due to the lower sales volume. Price and currency effects had no significant impact in the half-year comparison.
On the cost side, the increase in wafer area sold and higher depreciation due to investments had a particularly noticeable impact on the quarter-on-quarter comparison. As expected, a small loss from currency hedging transactions was recognized in the other operating result in Q2.
As a result, EBITDA in Q2 2024 remained almost unchanged compared to the previous quarter at EUR 90.6 million (Q1 2024: EUR 90.8 million) despite a slight increase in sales. At 25.8 percent, the EBITDA margin remained at a solid level (Q1 2024: 26.4 percent). In a half-year comparison, EBITDA fell to EUR 181.4 million (H1 2023: EUR 243.8 million), mainly due to lower demand, and reached a margin of 26.1 percent (H1 2023: 30.2 percent).
The decline in costs due to the lower sales volume was mitigated by a lower fixed cost dilution, and a lower currency hedging result was also noticeable in the half-year comparison. In addition, H1 2024 saw an increase in depreciation and amortization.
Net profit for the period fell from EUR 27.7 million in Q1 2024 to EUR 22.4 million in Q2 and from EUR 133.9 million in H1 2023 to EUR 50.1 million in H1 2024. In addition to the effects described above, a lower financial result due to investments contributed to the reduction. Earnings per share amounted to EUR 0.73 in Q2 2024 and EUR 1.59 in H1 2024.
Net assets and financial position still affected by high investments
With an equity ratio of 46.5 percent as of June 30, 2024, Siltronic continues to have a good balance sheet quality (December 31, 2023: 46.6 percent). Cash and cash equivalents and short-term financial investments fell by EUR 129.5 million to EUR 327.4 million in H1 2024.
This was due to net payments for investments of EUR 411.2 million with a focus on the new 300 mm fab in Singapore and the dividend payment of EUR 36.0 million to Siltronic AG’s shareholders. In the same period, these payments were opposed by cash inflows of EUR 171.4 million from operating activities and cash inflows of EUR 150.0 million from a loan that was partially drawn.
Due to the high level of investments, the net cash flow fell to EUR -252.8 million and was negative, as expected. Accordingly, net financial debt increased by a total of EUR 283.5 million to EUR 639.2 million compared to December 31, 2023.
Guidance for 2024
The Executive Board of Siltronic AG has specified its guidance published at the end of April and now expects Group sales to decline by a high single-digit percentage compared to the previous year. With a view to the financial year 2024, this is primarily due to lower volumes as well as each slightly negative exchange rate- (EUR/USD 1.10), price- and product mix effects.
The EBITDA margin is expected to be at the upper end of the previously communicated range of 23 to 25 percent. However, the EBITDA margin in H2 will not reach the level of H1. Profitability in H2 will be impacted by both slightly negative price and product mix effects as well as ramp costs for the new Singapore fab, which will start to impact earnings in Q4.
In addition, one production line is scheduled for maintenance in Q4, which will be bridged by inventory reductions and will also have a negative impact on the margin. Capex is expected to be in the range of EUR 500 million to EUR 530 million, with depreciation and amortization below EUR 300 million.
Original – Siltronic
-
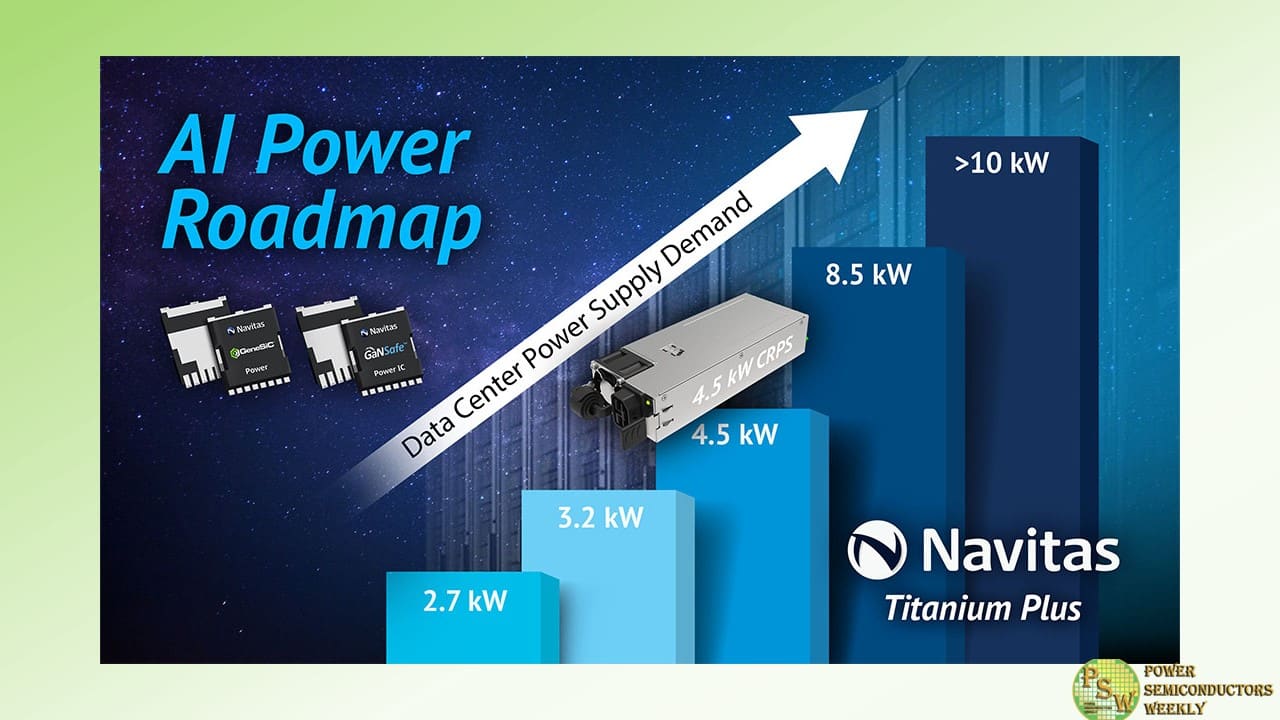
Navitas Semiconductor released its 4.5 kW AI data center power supply reference design, with optimized GaNSafe™ and Gen-3 ‘Fast’ (G3F) SiC power components. The optimized design enables the world’s highest power density with 137 W/in3 and over 97% efficiency.
Next-generation AI GPUs like NVIDIA’s Blackwell B100 and B200 each demand over 1 kW of power for high-power computation, 3x higher than traditional CPUs. These new demands are driving power-per-rack specifications from 30-40 kW up to 100 kW.
Navitas announced its AI Power Roadmap in March 2024, showcasing next-generation data center power solutions for the growing demand in AI and high-performance computing (HPC) systems. The first design was a GaNFast-based 3.2 kW AC-DC converter in the Common Redundant Power Supply (CRPS) form factor, as defined by the hyperscale Open Compute Project. The 3.2 kW CRPS185 (for 185 mm length) enabled a 40% size reduction vs. the equivalent legacy silicon approach and easily exceeded the ‘Titanium Plus’ efficiency benchmark, critical for data center operating models and a requirement for European data center regulations.
Now, the latest 4.5 kW CRPS185 design demonstrates how new GaNSafe™ power ICs and GeneSiC Gen-3 ‘Fast’ (G3F) MOSFETs enables the world’s highest power density and efficiency solution. At the heart of the design is an interleaved CCM totem-pole PFC using SiC with full-bridge LLC topology with GaN, where the fundamental strengths of each semiconductor technology are exploited for the highest frequency, coolest operation, optimized reliability and robustness, and highest power density and efficiency. The 650 V G3F SiC MOSFETs feature ‘trench-assisted planar’ technology which delivers world-leading performance over temperature for the highest system efficiency and reliability in real-world applications.
For the LLC stage, 650 V GaNSafe power ICs are ideal and unique in the industry with integrated power, protection, control, and drive in an easy-to-use, robust, thermally-adept TOLL power package. Additionally, GaNSafe power ICs offer extremely low switching losses, with a transient-voltage capability up to 800 V, and other high-speed advantages such as low gate charge (Qg), output capacitance (COSS), and no reverse-recovery loss (Qrr). High-speed switching reduces the size, weight, and cost of passive components in a power supply, such as transformers, capacitors, and EMI filters. As power density increases, next-gen GaN and SiC enable sustainability benefits, specifically CO2 reductions due to system efficiency increases and ‘dematerialization’.
The 3.2 kW and 4.5 kW platforms have already generated significant market interest with over 30 data center customer projects in development expected to drive millions in GaN and SiC revenue, ramping from 2024 into 2025.
Navitas’ AI data center power supply reference designs dramatically accelerate customer developments, minimize time-to-market, and set new industry benchmarks in energy efficiency, power density and system cost, enabled by GaNFast power ICs and GeneSiC MOSFETs. These system platforms include complete design collateral with fully tested hardware, embedded software, schematics, bills-of-material, layout, simulation, and hardware test results.
“AI is dramatically accelerating power requirements of data centers, processors and anywhere AI is going in the decades to come creating a significant challenge for our industry. Our system design center has stepped up to this challenge delivering a 3x increase in power in less than 18 months”, said Gene Sheridan, CEO of Navitas Semiconductor. “Our latest GaNFast technology, combined with our G3F SiC technology are delivering the highest power density and efficiency the world has ever seen…the perfect solution for the Blackwell AI processors and beyond.”
Original – Navitas Semiconductor
-

Renesas Electronics Corporation announced consolidated financial results in accordance with IFRS for the three and six months ended June 30, 2024.
Summary of Consolidated Financial Results (Note 1)
Summary of Consolidated Financial Results (Non-GAAP basis) (Note 2)
Three months ended June 30, 2024 Six months ended June 30, 2024 Billion Yen % of Revenue Billion Yen % of Revenue Revenue 358.8 100.0 710.6 100.0 Gross profit 203.6 56.7 402.9 56.7 Operating profit 110.6 30.8 224.1 31.5 Profit attributable to owners of parent 96.7 26.9 202.5 28.5 EBITDA (Note 3) 132.8 37.0 266.6 37.5 Summary of Consolidated Financial Results (IFRS basis)
Three months ended June 30, 2024 Six months ended June 30, 2024 Billion yen % of Revenue Billion yen % of Revenue Revenue 358.8 100.0 710.6 100.0 Gross profit 200.9 56.0 398.4 56.1 Operating profit 69.7 19.4 147.6 20.8 Profit attributable to owners of parent 59.8 16.7 139.6 19.6 EBITDA (Note 3) 120.6 33.6 246.3 34.7 Reconciliation of Non-GAAP gross profit to IFRS gross profit and Non-GAAP operating profit to IFRS operating profit
(Billion yen)
Three months ended June 30, 2024 Six months ended June 30, 2024 Non-GAAP gross profit
Non-GAAP gross margin203.6
56.7%402.9
56.7%Amortization of purchased intangible assets and depreciation of property, plant and equipment (0.3) (0.5) Stock-based compensation (0.8) (1.2) Other reconciliation items in non-recurring
expenses and adjustments (Note 4)(1.6) (2.7) IFRS gross profit
IFRS gross margin200.9
56.0%398.4
56.1%Non-GAAP operating profit
Non-GAAP operating margin110.6
30.8%224.1
31.5%Amortization of purchased intangible assets and depreciation of property, plant and equipment (28.7) (56.3) Stock-based compensation (9.2) (14.8) Other reconciliation items in non-recurring expenses and adjustments (Note 4) (2.9) (5.4) IFRS operating profit
IFRS operating margin69.7
19.4%147.6
20.8%- Note 1: All figures are rounded to the nearest 100 million yen.
- Note 2: Non-GAAP figures are calculated by removing or adjusting non-recurring items and other adjustments from GAAP (IFRS) figures following a certain set of rules. The Group believes non-GAAP measures provide useful information in understanding and evaluating the Group’s constant business results.
- Note 3: Operating profit + Depreciation and amortization.
- Note 4: “Other reconciliation items in non-recurring expenses and adjustments” includes the non-recurring items related to acquisitions and other adjustments as well as non-recurring profits or losses the Group believes to be applicable.
Original – Renesas Electronics
-

STMicroelectronics reported second quarter net revenues of $3.23 billion, gross margin of 40.1%, operating margin of 11.6%, and net income of $353 million or $0.38 diluted earnings per share.
Jean-Marc Chery, ST President & CEO, commented:
- “Q2 net revenues were above the midpoint of our business outlook range driven by higher revenues in Personal Electronics, partially offset by lower than expected revenues in Automotive. Gross margin was in line with expectations.”
- “First half net revenues decreased 21.9% year-over-year, mainly driven by a decrease in Microcontrollers and Power and Discrete segments. Operating margin was 13.8% and net income was $865 million.”
- “During the quarter, contrary to our prior expectations, customer orders for Industrial did not improve and Automotive demand declined.”
- “Our third quarter business outlook, at the mid-point, is for net revenues of $3.25 billion, decreasing year-overyear by 26.7% and increasing sequentially by 0.6%; gross margin is expected to be about 38%, impacted by about 350 basis points of unused capacity charges.”
- “We will now drive the Company based on a plan for FY24 revenues in the range of $13.2 billion to $13.7 billion. Within this plan, we expect a gross margin of about 40%.”
Original – STMicroelectronics
